Lesson 2 : Scatter Plots
Video 1: Types of Graphs to Display Data
Video 2: How to Create a Scatter Plot
Note: Independent variable is plotted on the horizontal axis and dependent variable is plotted on the vertical axis
Note: Independent variable is plotted on the horizontal axis and dependent variable is plotted on the vertical axis
Video 3: Creating a Scatter Plot with a Break on the Axes
First: Draw the small grid lines for labelling your axes (same distance between the grid lines)
Second: Label the grid lines with the same jump in numbering (every 2's, every 10's or every 100's)
Don't label the axes with the numbers given in the table. You approximate those numbers along the axes when plotting!
You may break an axis to skip unnecessary lower values using the "lighting symbol" at the beginning of the axis.
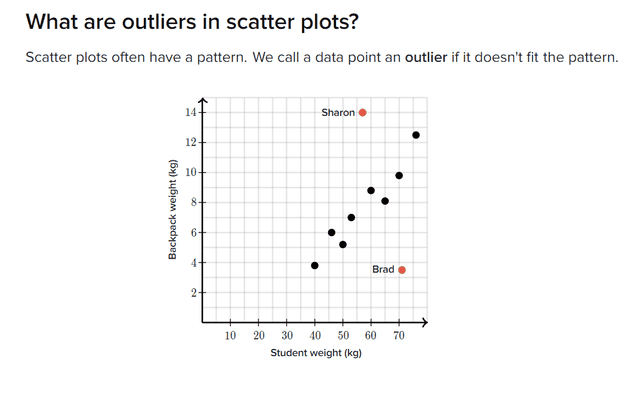
Video 4: Identifying Outliers in a Scatter Plot
Click on the image below to access Khan Academy's online quiz on understanding outliers in scatter plots.
Summary on Scatter Plots:
|
Worksheet 6-2
|
| ||
